From Logs to Visualization: Building a Serverless Geo-Dashboard

Closing the Loop: Building a Serverless Geo-Dashboard for Drone Fleets
In my previous post, I successfully built a pipeline to extract GPS metadata from DJI photos using S3 and Lambda. However, data trapped in a CloudWatch log is just potential. To make it truly useful, I needed to close the loop: transforming that raw telemetry into a functional, real-time Geo-Dashboard.
In this second phase, I’ll show you how I evolved the architecture into a full-stack serverless application, ensuring every drone flight in Gdańsk is instantly mapped—all while staying within the AWS Free Tier.
Phase 8: Data Persistence (Amazon DynamoDB)
For the map to display markers, the telemetry needs a permanent, high-speed home. I chose Amazon DynamoDB, a NoSQL database service.
- The Strategy: I designed a table with
ImageIDas the Partition Key to store coordinates, altitude, and timestamps. - The Workflow: I updated the “Ingestion Lambda” to perform an automatic
PutItemoperation after extraction. - The Result: Every flight is now indexed in milliseconds, providing a scalable foundation for thousands of mission points.
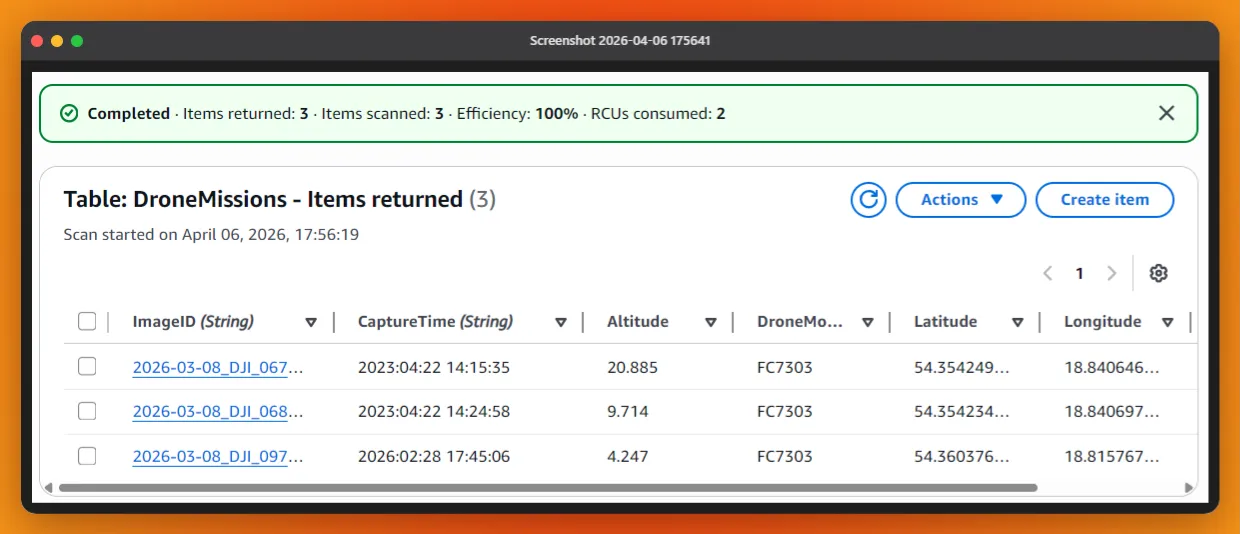 Figure 1: NoSQL Persistence: The extracted metadata now resides in DynamoDB, ready to be queried by the frontend.
Phase 9: The Data Bridge (Amazon API Gateway)
A secure architecture prevents the frontend from talking directly to the database. I needed a managed “front door.”
The Solution: RESTful API I deployed Amazon API Gateway to trigger a second Lambda function (the “Reader”) that fetches items from DynamoDB.
- CORS Configuration: A critical step was enabling Cross-Origin Resource Sharing to allow my S3-hosted website to request data securely.
- Security Pillar: This decoupled approach ensures that my database remains private, exposing only the necessary geospatial data through a controlled endpoint.
Phase 10: Interactive Visualization (Leaflet.js & S3 Hosting)
To bring the data to life, I chose the simplicity of open-source mapping tools.
- Hosting: My
index.htmland assets are hosted in an S3 bucket configured for Static Website Hosting. - The Logic: I used Leaflet.js to render the map. The script performs a
fetch()call to the API Gateway, receives the JSON payload from DynamoDB, and dynamically plots markers over Gdańsk, Poland. - Real-time Feel: Seeing the satellite icon 🛰️ appear exactly where the drone was positioned during the flight was the ultimate validation of the pipeline.
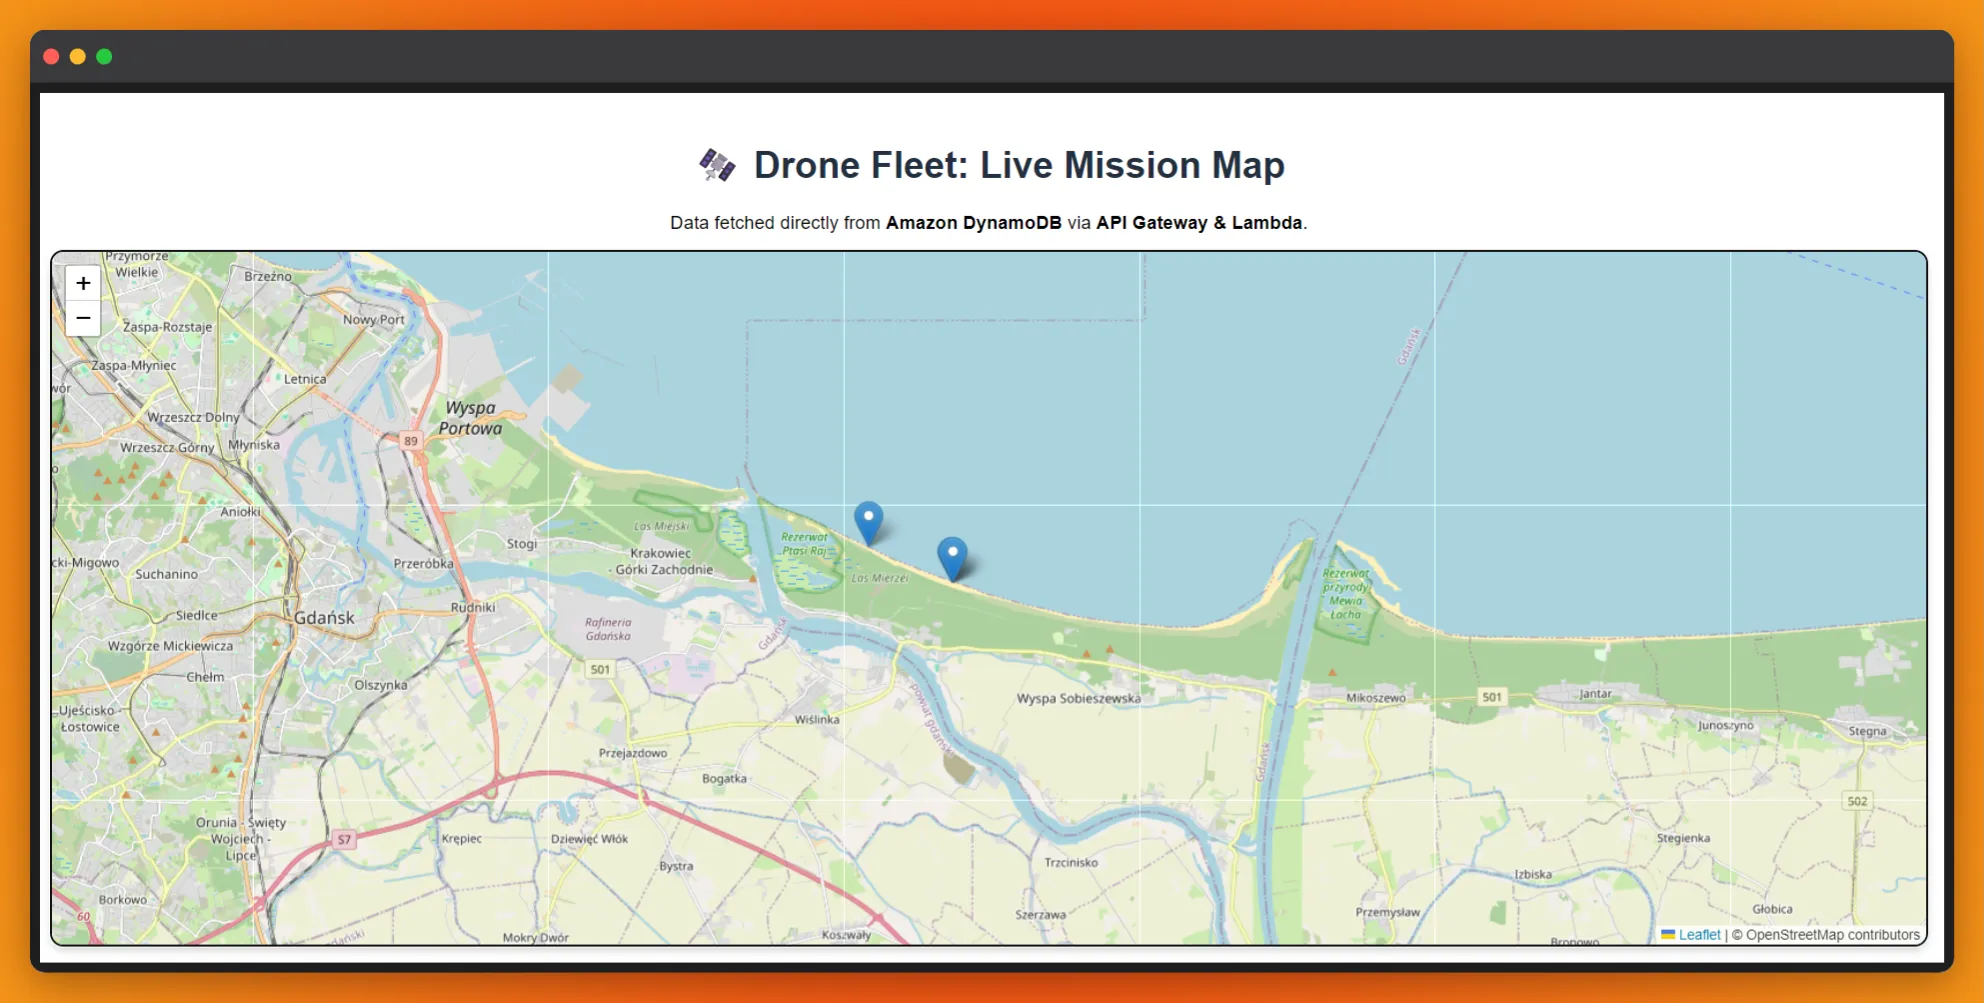 Figure 2: Geo-Dashboard in action: Visualizing processed telemetry directly from drone missions in the Stogi area.
Phase 11: Learning through the Terminal (AWS CLI)
While the AWS Console is helpful, I performed the final deployments and image uploads using the AWS CLI on Ubuntu.
- Technical Precision: Working in a Linux environment taught me the importance of case sensitivity (e.g.,
.JPGvs.jpg) and path management. - Efficiency: Using
aws s3 cpallows for a much faster iteration cycle than manual uploads, mimicking a professional DevOps workflow.
Conclusion: A “Living” Architecture
The result is a complete Event-Driven Architecture (EDA). There are no idle servers, no expensive licensing fees—just code that springs to life exactly when needed. When I land my drone and sync my files from the terminal, the cloud handles the rest, building my mission map automatically.
What’s next? My next challenge will be recreating this entire process from scratch using Claude (AI). I want to compare the efficiency and accuracy of AI-assisted code generation against the manual, hands-on process I’ve just completed. Documenting this “Human vs. AI” workflow will be my next deep dive.
Want to talk Serverless or GIS? > Connect with me on LinkedIn or check out my GitHub for more project details.